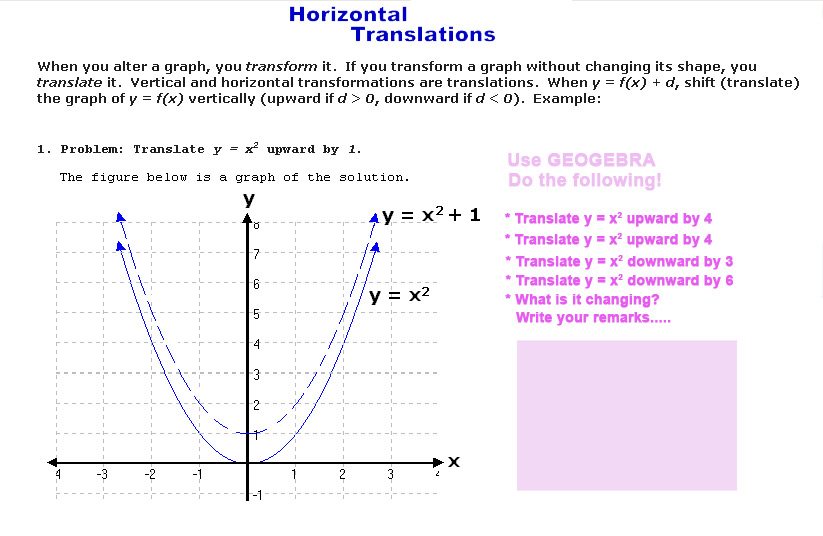
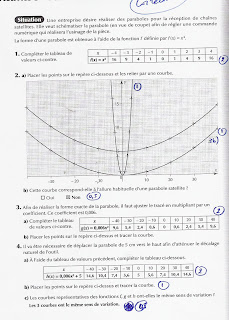
 (extrait du livre "maths 2nde" Alain Redding-Sylvain Berco Editions Bertrand-Lacoste).
________________________________________________________
ΛΗΨΗ ΔΟΡΥΦΟΡΙΚΩΝ ΠΡΟΓΡΑΜΜΑΤΩΝ
ΜΕ ΠΑΡΑΒΟΛΙΚΑ ΚΑΤΟΠΤΡΑ
Γενικά
Στην Ελλάδα, οι πιο εμπορικοί δορυφόροι είναι ο Hotbird 13Eº και ο Astra 19.2Eº, που στην πραγματικότητα είναι ομάδες δορυφόρων στην ίδια τροχιακή θέση, και εκπέμπουν μεγάλο αριθμό καναλιών από το ίδιο σημείο.
Από την Ελλάδα, αν συντονιστείτε στην τροχιακή θέση Hotbird, με ένα απλό ψηφιακό δορυφορικό δέκτη, μπορείτε να κάνετε λήψη 1.000 περίπου καναλιών (τηλεοπτικών και ραδιοφωνικών,) πολλά από τα οποία είναι FTA (free to air δηλαδή χωρίς κωδικοποίηση). Αν συντονιστείτε και στον Astra τότε τα κανάλια θα φτάσουν στα 1.800.
Για να έχουμε δορυφορική λήψη τηλεοπτικού σήματος μας χρειάζεται ένας δορυφορικός δέκτης που θα συνδεθεί στην τηλεόραση και αποτελείται από
ένα κάτοπτρο (η παράβολος)
και το LNB (ο κυματοδηγός)
To LΝΒ είναι το εξάρτημα που κάνει την λήψη (το κάτοπτρο συγκεντρώνει το σήμα) και θα πρέπει να συνδεθεί με ομοαξονικό καλώδιο με τον δορυφορικό δέκτη.

Η
παράβολος είναι το εξάρτημα που έχει την ιδιότητα να
ανακλά και ταυτόχρονα να
συγκεντρώνει τα
ηλεκτρομαγνητικά κύματα σε ένα σημείο (στο εμπρός έσω-κοίλο μέρος της), που ονομάζεται
πρωτεύων σημείο συγκέντρωσης (Primary focal point).
Here is an animation showing how parallel radio waves are collected by a parabolic antenna.
A Company uses parabolic antennas (satellite receiver) for receiving television signals. It wants to form the antennas. It uses the function f as f(x)= x2 in order to improve the schema of the parabola of the satellite receiver. As a application of the above work open the file
parabole_satellite.xls and fill in the following table of values for the functions
f(x)= x2,
g(x) =
0,006*x2 and
h(x)=f(x)= 0,006*x2+5. Afterward draw the relevant curves (2D Cartesian Graph).
A Parabola is the set of all points that are equidistant from a point and a line. The line is called the directrix and the point is called the focus. Each point on the parabola is as far from the directrix as it is from the focus. It is the same shape of a curve you will find in the reflector of a flashlight bulb, or in the arc of a baseball when it is thrown or hit.
ΕΦΑΡΜΟΓΗ:
Εταιρία χρησιμοποιεί τα παραβολικά κάτοπτρα (δορυφορικοί δέκτες) για τη λήψη τηλεοπτικών σημάτων. Θέλει να σχηματοποιήσει τις παραβόλους (παραβολικά κάτοπτρα σε τομή) μετά από ψηφιακό έλεγχο, που διενεργεί στο στάδιο επεξεργασίας του κάθε κομματιού.
Το σχήμα μιας παραβόλου παρέχεται από μια συνάρτηση f με τύπο f(x)= x2
Στα μαθηματικά η γραφική παράσταση της παραπάνω συνάρτησης λέγεται ΠΑΡΑΒΟΛΗ.
1. Ανοίξτε το αρχείο
parabole_satellite.xls και συμπληρώστε τον πίνακα:
2. Τοποθετείστε τα σημεία στο ορθοκανονικό σύστημα συντεταγμένων και συνδέστε τα.
Νομίζετε πως αυτή η γραμμή
αντιστοιχεί στο συνηθισμένο παραβολικό κάτοπτρο (πιάτο) (σε τομή), που ξέρετε; (Ναί/Όχι)
.........................................................................................................
3. Για να πετύχουμε το ακριβές σχήμα της παραβόλου, πρέπει να ρυθμίσουμε το ίχνος της γραμμής, και γι'αυτό πολλαπλασιάζουμε με έναν συντελεστή. Στη δική μας περίπτωση έστω ο συντελεστής ότι είναι
0,006.
α) Συπληρώστε τον παρακάτω πίνακα τιμών
β) Τοποθετείστε τα σημεία (x, g(x)) στο ορθοκανονικό σύστημα συντεταγμένων και φτιάξτε τη καμπύλη.
4. Eίναι απαραίτητο να τοποθετήσετε τη παραβολή 5 εκ. πιο ψηλά (για να καλύψουμε τις ανοχές).
α) Συμπληρώστε το παρακάτω πίνακα τιμών:
β) Τοποθετείστε τα σημεία (x, h(x))στο ορθοκανονικό σύστημα συντεταγμένων και φτιάξτε τη καμπύλη.
γ) Οι 3 καμπύλες που είναι οι γραφικές παραστάσεις των συναρτήσεων f, g και h έχουν την ίδια μονοτονία;
........................................................................................................
_________________________________________________________
ΓΙΑ ΤΟΥΣ ΜΑΘΗΤΕΣ: χρησιμοποιήστε το Excel ή την ΑΡΙΘΜΟΜΗΧΑΝΗ για τους υπολογισμούς!
Use Excel or your calculator for the calculations!


 Work
Work